


As I get on with age, I realise I am becoming poorer in remembering things.
This is especially a problem when I have to remember the methodology of particular funds that I own because the information that I need to revisit from time to time is hidden in particular pages of particular PDFs. Hunting them down takes a lot of time.

I might as well take this opportunity to try and internalize the information I often need and make it easier to search for.
This page thus collates information on the WisdomTree Global Quality Dividend Growth UCITS ETF (GGRA/GGRG). This is more of a systematically active quality/profitability factor ETF. The ETF is domiciled in Ireland which makes your investments more tax efficient. Withholding tax for the 60% underlying US companies to the ETF is 15% instead of 30% due to Ireland’s dual-taxation treaty with the US. Estate that owns Ireland-domiciled funds currently do not need to pay estate taxes.
There are both accumulating and distributing share class for the ETF. The current Total Expense Ratio is 0.38%.

The ETF seeks to replicate the performance of the WisdomTree Global Developed Quality Dividend Growth index. In my opinion, the dividend growth leads some to think that this is a unique dividend portfolio. Still, this index leads us down to a portfolio of quality stocks that pay smaller but sturdier dividends.
Some still believe that underlying all stocks is that they have to be able to value by their cash flow return and dividend is the basis of cash flow payback.
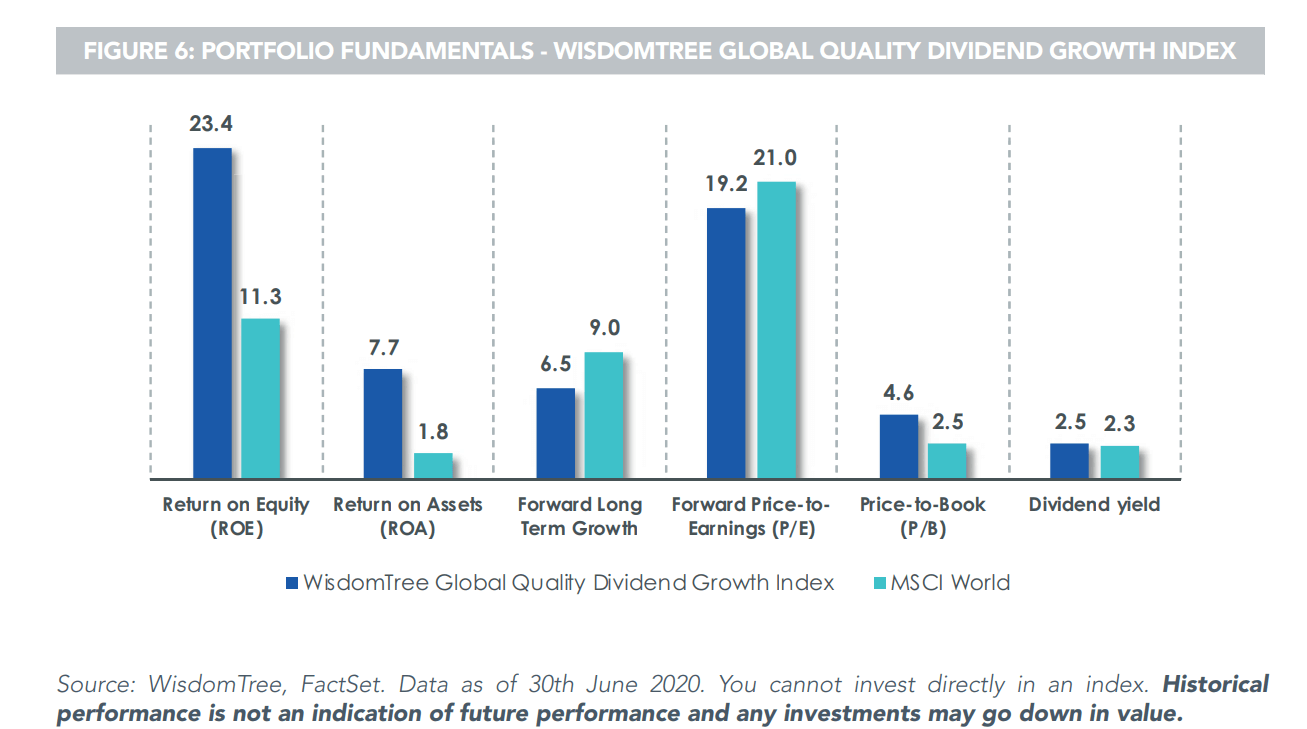
By screening the way they did, we get a portfolio of companies with medium-term dividend growth, higher ROE, ROA or medium-term earnings growth. This gives a 600-stock portfolio that has the ability to deliver sturdier earnings over time.

This factor index gets screened and reconstituted annually.
Resources to understand more of the Fund
- Page to the WisdomTree Global Developed Quality Dividend Growth Index (WTDDG)
- Index Methodology
- Paper from WisdomTree On Quality Dividend Growth (20 pages)
- Paper from WisdomTree The Dividends of a Quality and Growth Factor Approach (22 pages)
- The link between Warren Buffett’s Quality Investing Philosophy & WisdomTree’s Quality Dividend Growth Approach
- Notes on WisdomTree index reconstitution
- WisdomTree Global Quality Dividend Growth ETF USD Acccumulating Morningstar Page
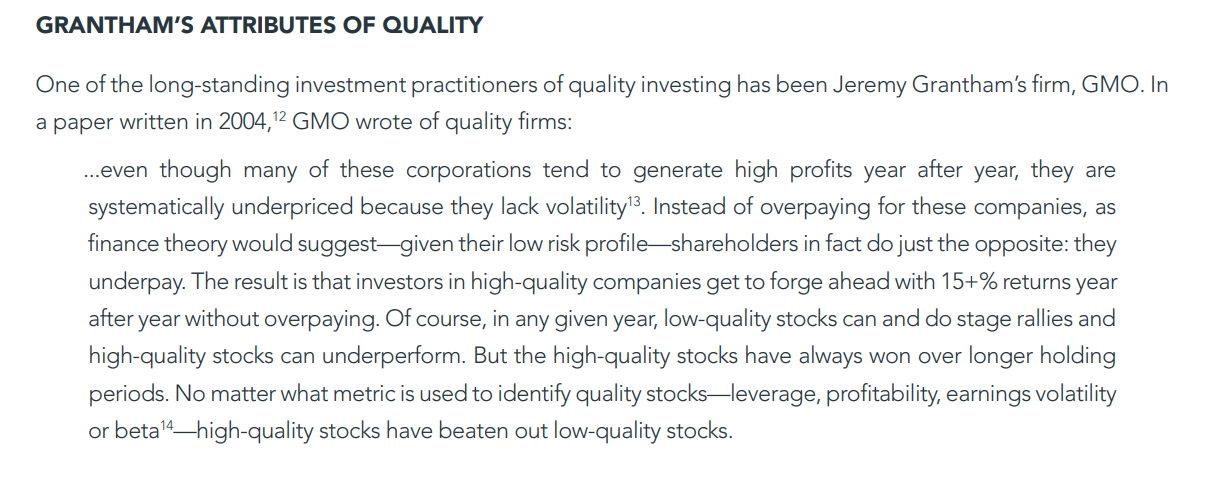
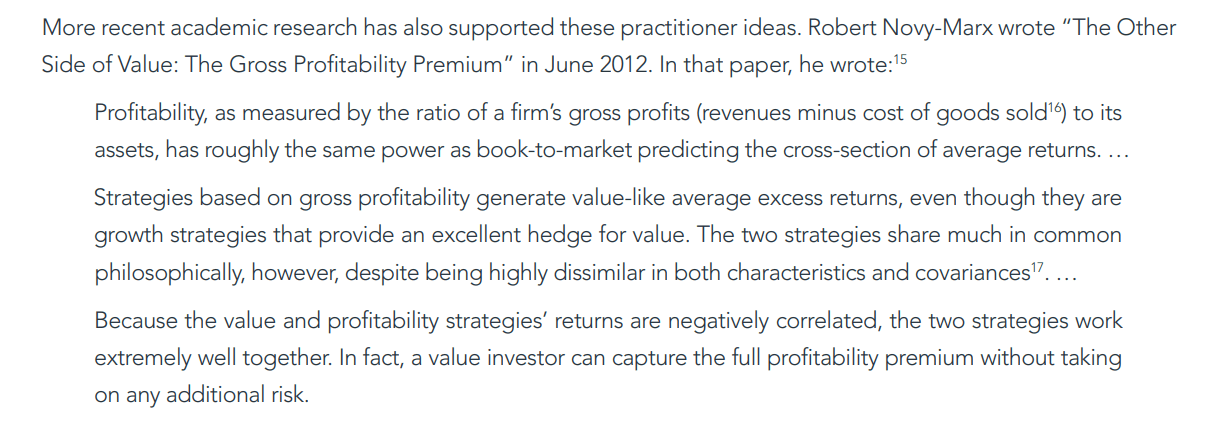
Grantham and Robert Novy-Marx on Drivers of the Quality Style Factor
Considered Region
The WisdomTree Global Dividend Index includes companies from the developed world only.
Companies that are incorporated in:
- United States
- Europe
- Isreal
- Japan
- Australia
- New Zealand
- Hong Kong
- Singapore
- Canada
Company Criteria for Eligible Company Consideration.
Companies must be at least $2 billion as of the Global Screening Date.
The companies also have to pay dividends in the last 12 months and have dividend coverage ratios greater than 1.0 times.
Earnings yield must be greater than the dividend yield to be eligible for inclusion. So this means that the company is not paying dividends more than they are earning.
How the Eligible Companies are then Ranked and Considered.
The main focus is to invest in companies that:
- Are profitable
- Generate and grow earnings
- Do not use excessive leverage
- Have a sustainable dividend policy
- Are fairly priced
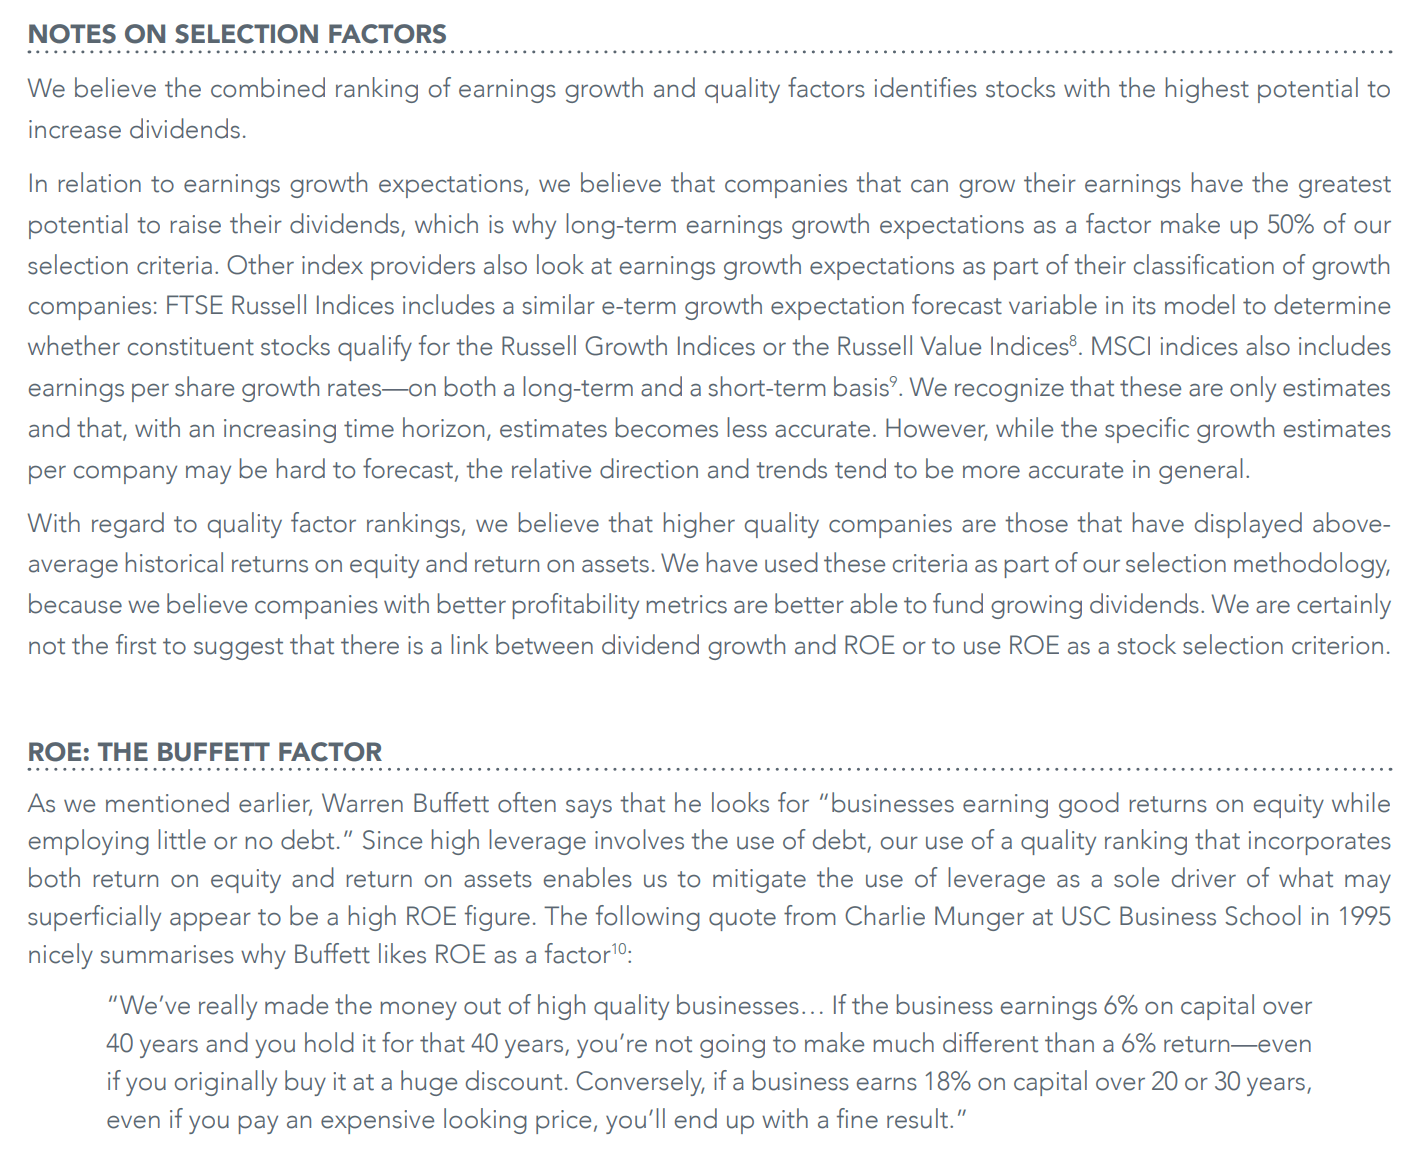
Eligible companies are ranked using a weighted combination of 3 factors:
- 50% to the rank of medium-term estimated earnings growth.
- 25% to the rank of historical 3-year average ROA (net profit divided by total assets)
- 25% to the rank of historical 3-year average ROE (net profit divided by total equity)
50% focus on earnings growth in the future (they need the data that show earnings growth estimates), and 50% focus on the profits relative to the asset or capital base. ROE tends to be jacked up by leverage, and I think ROIC or ROA is a better measure of how good the business is relative to the capital needed consistently. A capital-intensive business will have a low ROA. A highly leveraged business will have a high ROE but maybe a low ROA.
Good ROA and ROE are also not much use if the earnings do not grow.
Hence the other 50% is to screen for businesses that are at least growing in the near term. This screen potentially identify companies with narrow or wide economic moats but probably doesn’t specifically point them out because of the tenor of estimated earnings growth profiled.
Companies with negative equity and, therefore, undefined return on equity, they will be given a median score as long as they show dividend growth over the past 5 years. There are many companies such as Macdonalds that fall into this category. Macdonalds generates consistent free cash flow but instead of taking the free cash flow to pay off their debt, they buyback the shares. The debt interest expense is lower than the earnings yield, so the management is taking the cash flow and buying back the highest cost capital. What this does is their equity eventually is lesser than their debt.
This does not mean the company is not prudent but companies with poor fundamentals can have negative equity as well. Thus, WisdomTree needs to screen for companies with at least 5 years of dividend growth because it is likely shitty companies cannot have earnings over such a tenor and be able to pay out dividends. It shows quality to be able to grow your dividends over a five year period.
Companies that lack medium-term earnings growth estimates will use 50% ROA and 50% ROE.
After the stocks are ranked, the top 600 companies that meet the criteria will be selected for inclusion.
From WisdomTree:
How Selected Companies are Weighted and Capped.
The selected companies are weighted based on the amount of dividends they pay out as opposed to weighting by market capitalization for the MSCI World or S&P 500.
To be specific, they are weighted based on Gross Cash Dividends paid over the latest annual cycle as determined by the ex-date of the dividends. Companies in Australia, the gross dividends will not reflect ranking credit.
The currency rate used to translate the dividends to U.S dollars is the exchange rate on the screening date.
A Cash Dividend Factor is calculated for every component in the Index and then summed.
Each component’s weight is equal to the Cash Dividend Factor divided by the sum of all Cash Dividend Factor.
If the dividend yield of the companies is greater than 12%, then the weightage is capped.
Should any company have weighting >= 24% of the index, its weighting will be reduced to 20% at the close of the calendar quarter.
Here are the other weighing rules:
- Max weight of individual security capped at 5% on annual rebalance.
- Any country, except U.S. weighs >= 25% of index, the weight will be reduced to 25%.
- U.S. weight will be capped at 60%.
- Sector weight capped at 20%. Real Estate sector capped at 15%.
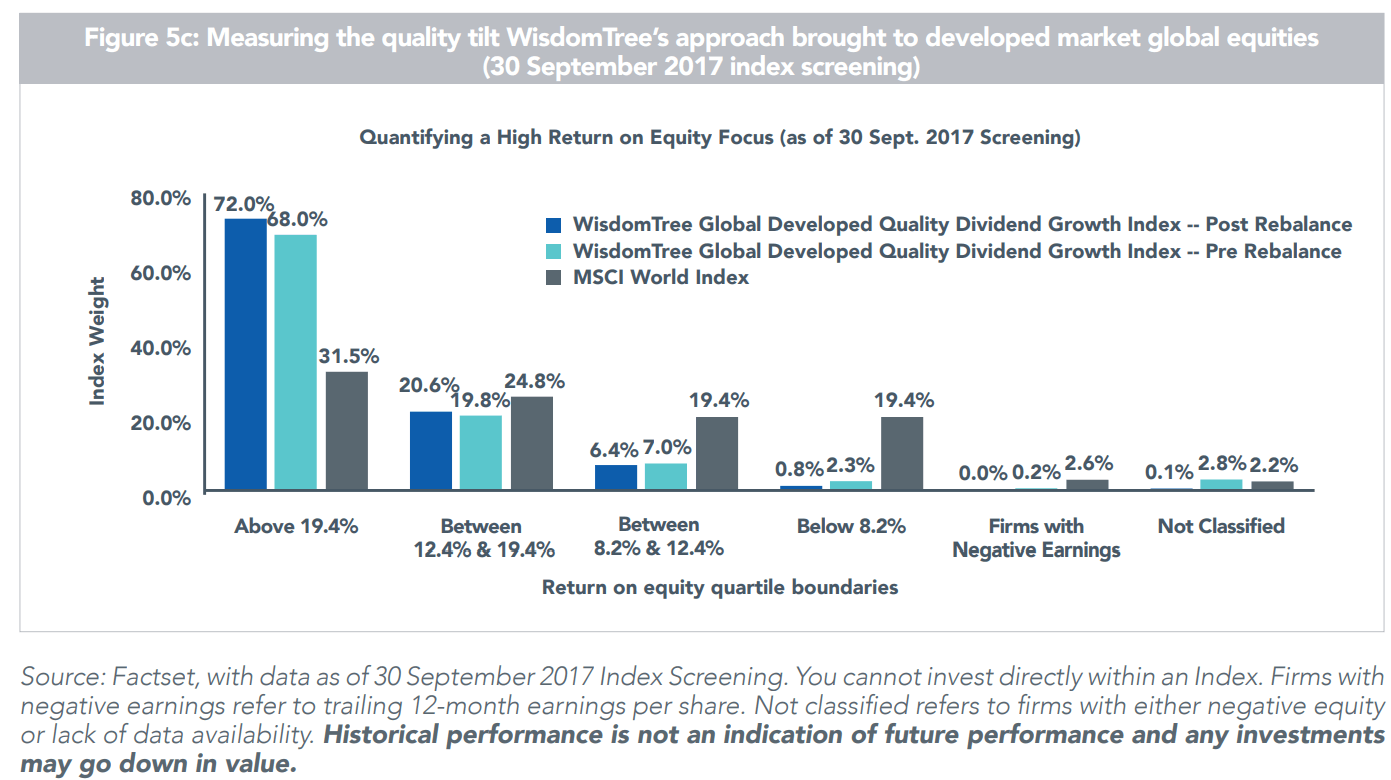
Greater Higher ROE Companies
With the weighing and ranking, this result in a portfolio of companies that has a smaller number of low ROE companies:
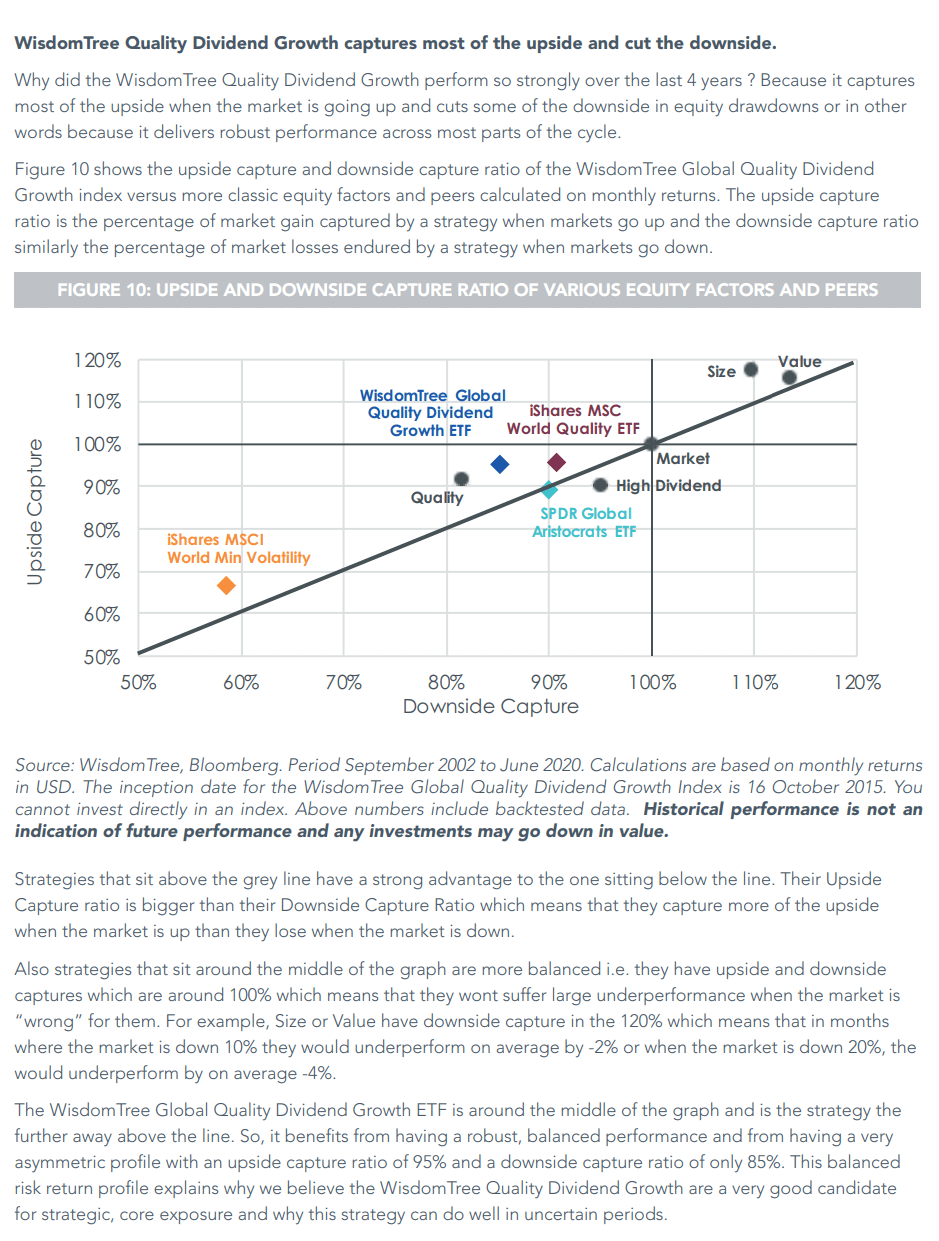
Upside and Downside Capture
Index Reconstitution
Index reconstitution, which means the index re-screens and identifies the new 600 position in End September.
The changes will be implemented on the 18-20th of October and will be publish on the WisdomTree website on the actual day.
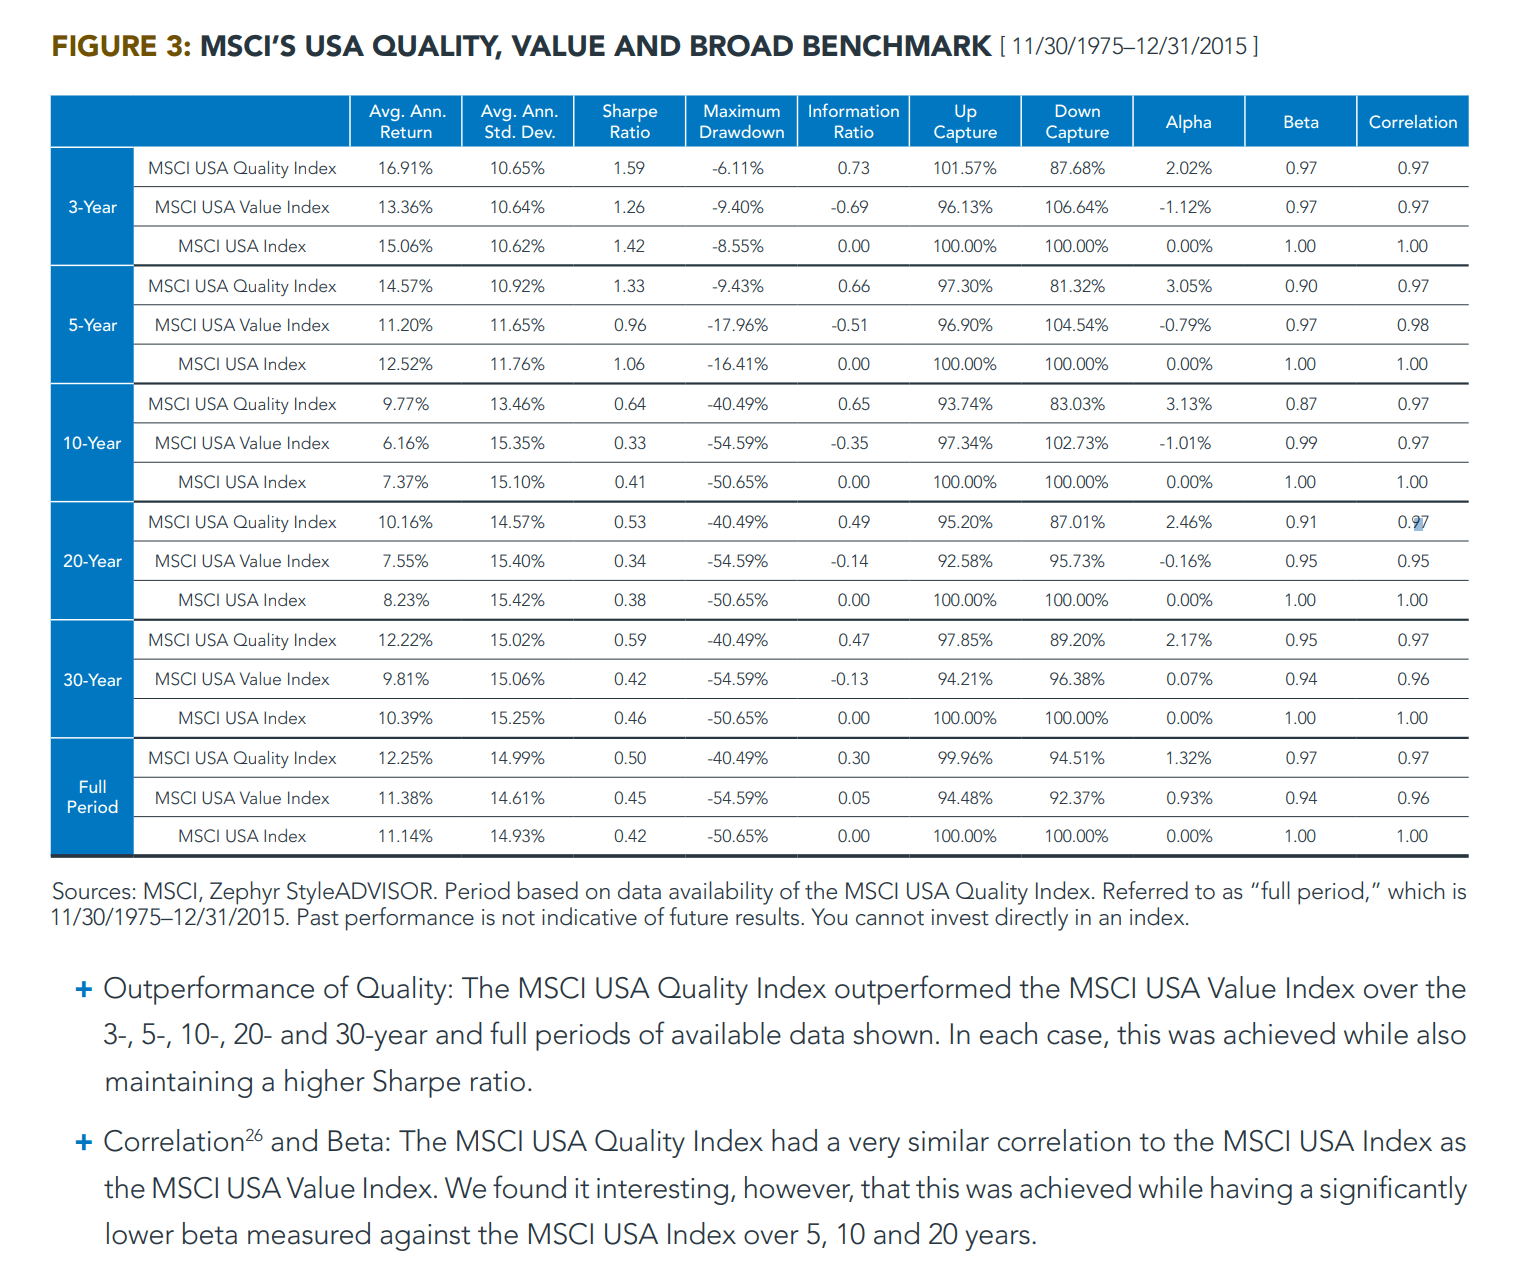
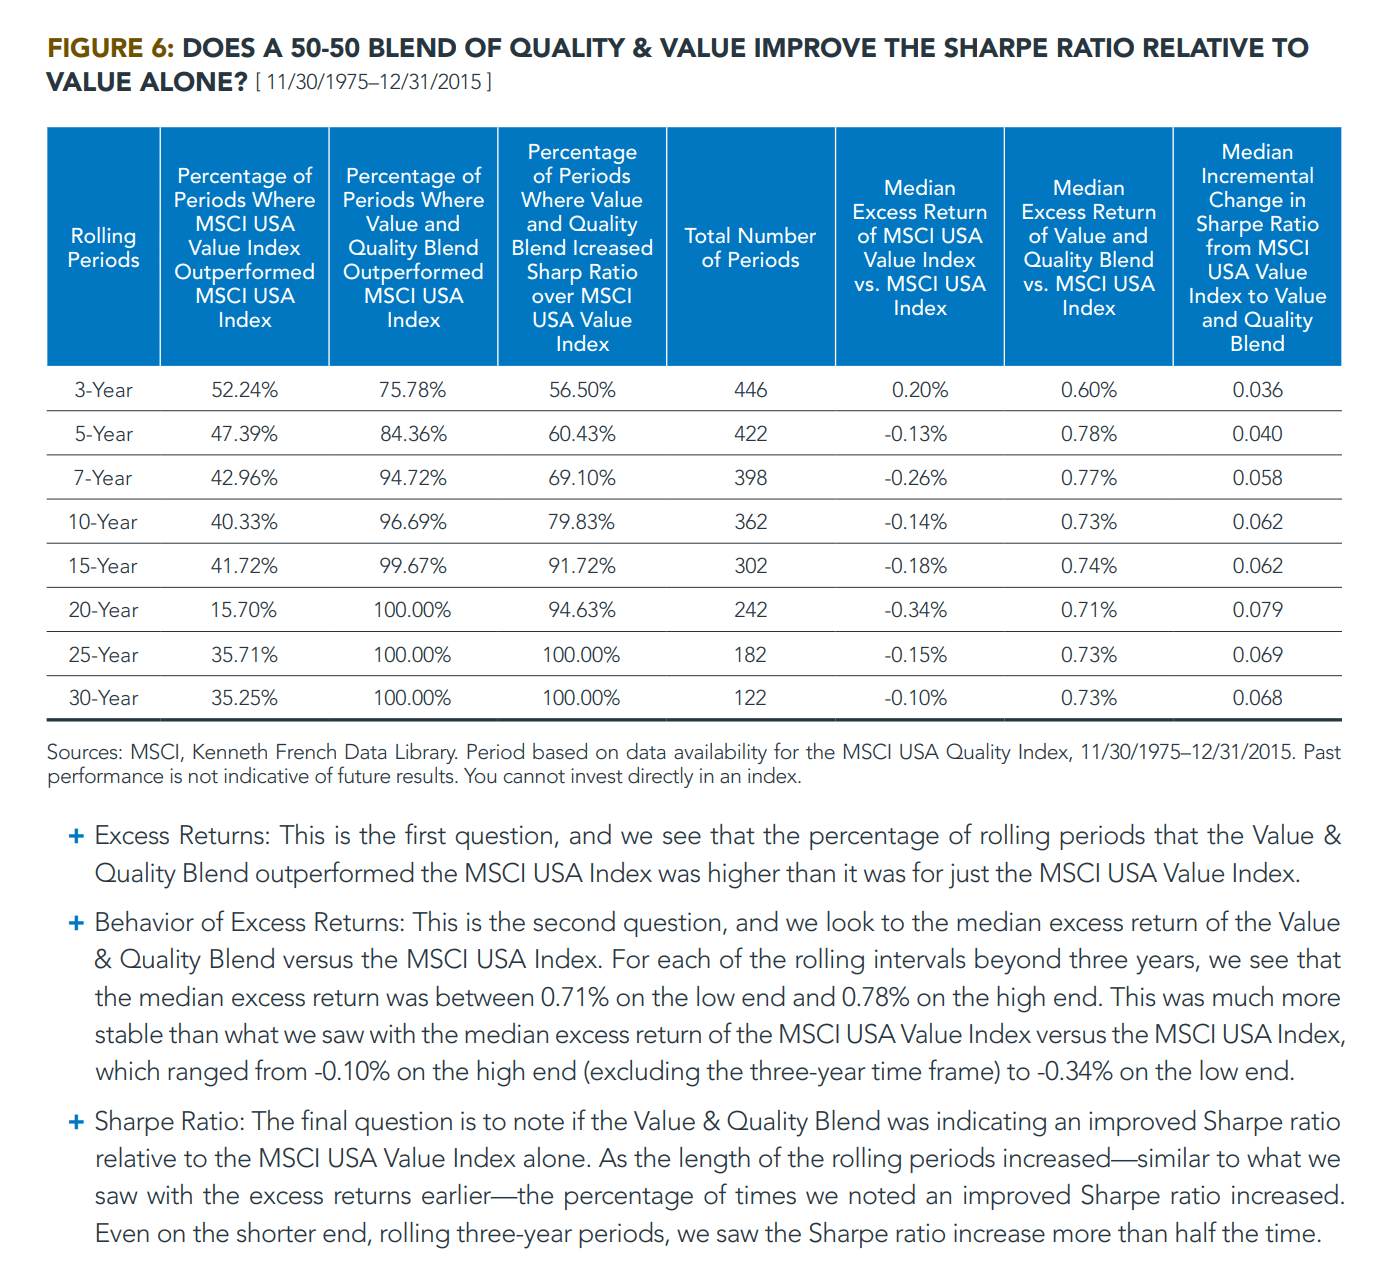
The Case for Quality Value from MSCI’s Quality and Value Data (1975 to 2015 | 41 years)
MSCI defines quality pretty similar to how GMO defines quality:
- ROE: Last 12-month earnings per share divided by the current book value per share
- Debt to Equity: Last fiscal year total debt divided by the total book value
- Earnings Stability: Standard deviation of you EPS growth over the past 5 years
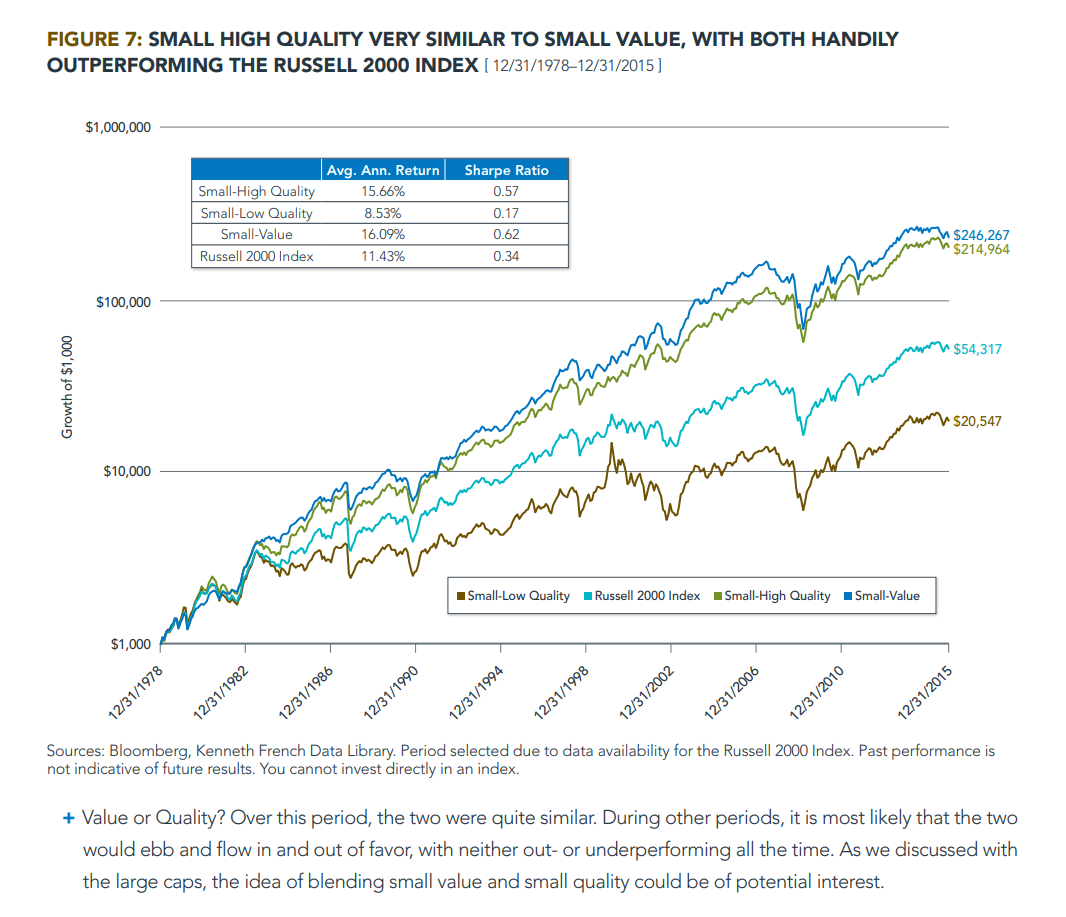
Small Cap Quality Similarity with Small Cap Value
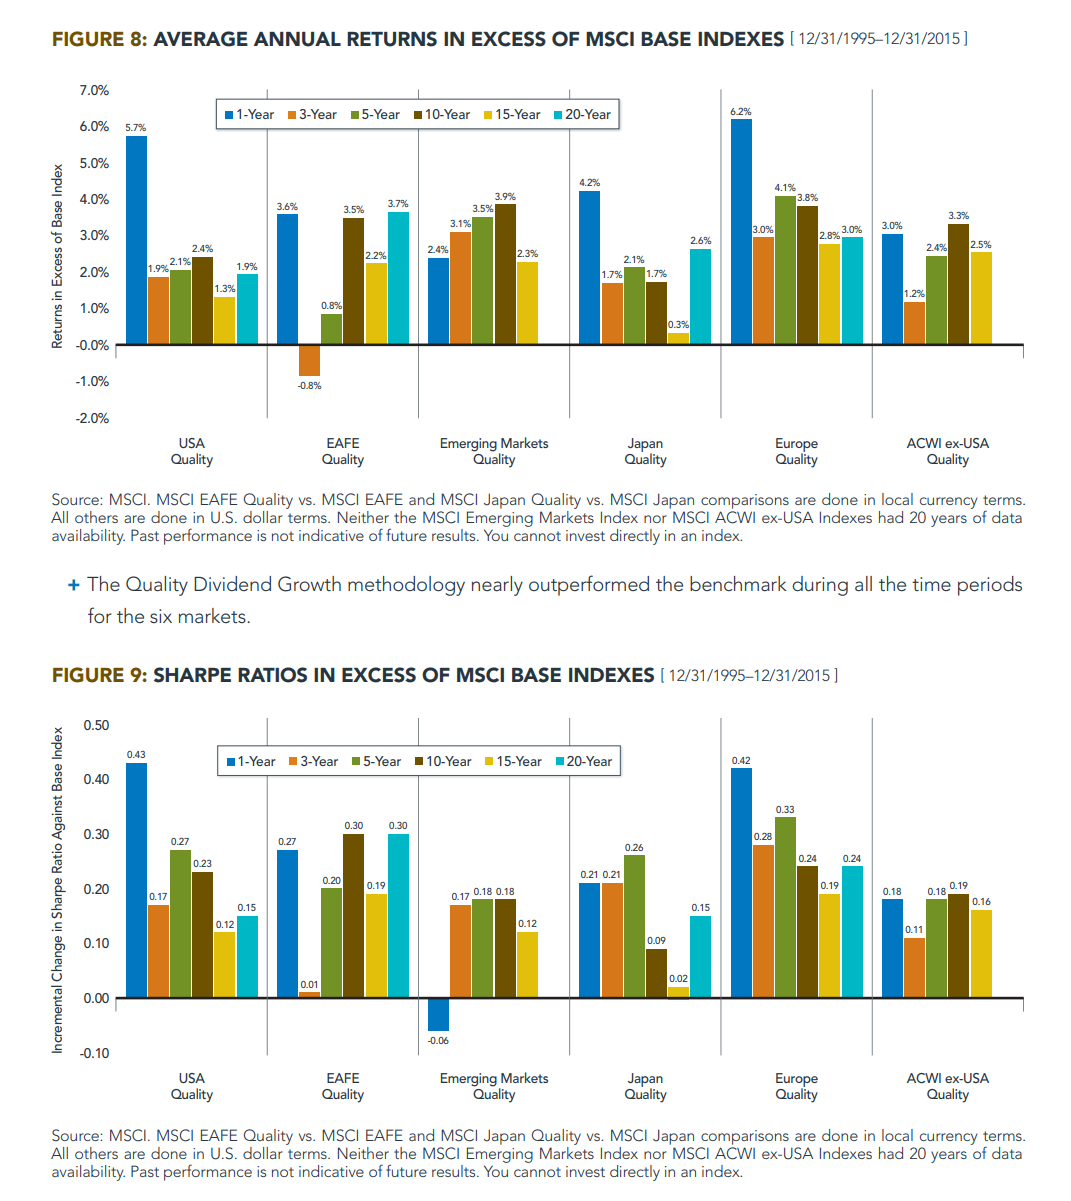
The Pervasiveness of the Quality Style Factor
Recent Calendar Year ETF Performance Comparison
Eurozone Quality Dividend Growth
I want to compare the performance of a region that is not doing too well. Returns are in EUR.
| WisdomTree Eurozone Quality Dividend Growth Acc (EGRA) | iShares Core MSCI Europe Acc (SMEA) | |
| 2017 | 22% | 10.3% |
| 2018 | -15.3% | -10.4% |
| 2019 | 32.4% | 26.4% |
| 2020 | 6.4% | -3.2% |
| 2021 | 24.6% | 25.5% |
| 2022 | -19.2% | -9.2% |
The Eurozone performance look good.
US Quality Dividend Growth
Returns in USD
| WisdomTree US Quality Dividend Growth Acc (DGRA) | CSPX | |
| 2017 | 27% | 21.6% |
| 2018 | -6.6% | -5.5% |
| 2019 | 28.8% | 30.6% |
| 2020 | 12.6% | 17.6% |
| 2021 | 25.3% | 29.4% |
| 2022 | -8.3% | -18.7% |
S&P 500 did better during this period. Biggest performance difference was during 2017 and 2022.
Global Quality Dividend Growth
| WisdomTree Global Quality Dividend Growth Acc (GGRA) | IWDA | |
| 2017 | 25.4% | 22.8% |
| 2018 | -8.6% | -9.0% |
| 2019 | 35% | 27.8% |
| 2020 | 16.5% | 16.0% |
| 2021 | 19.4% | 22.2% |
| 2022 | -13.7% | -18.1% |
The Global Quality Dividend Growth did very well.
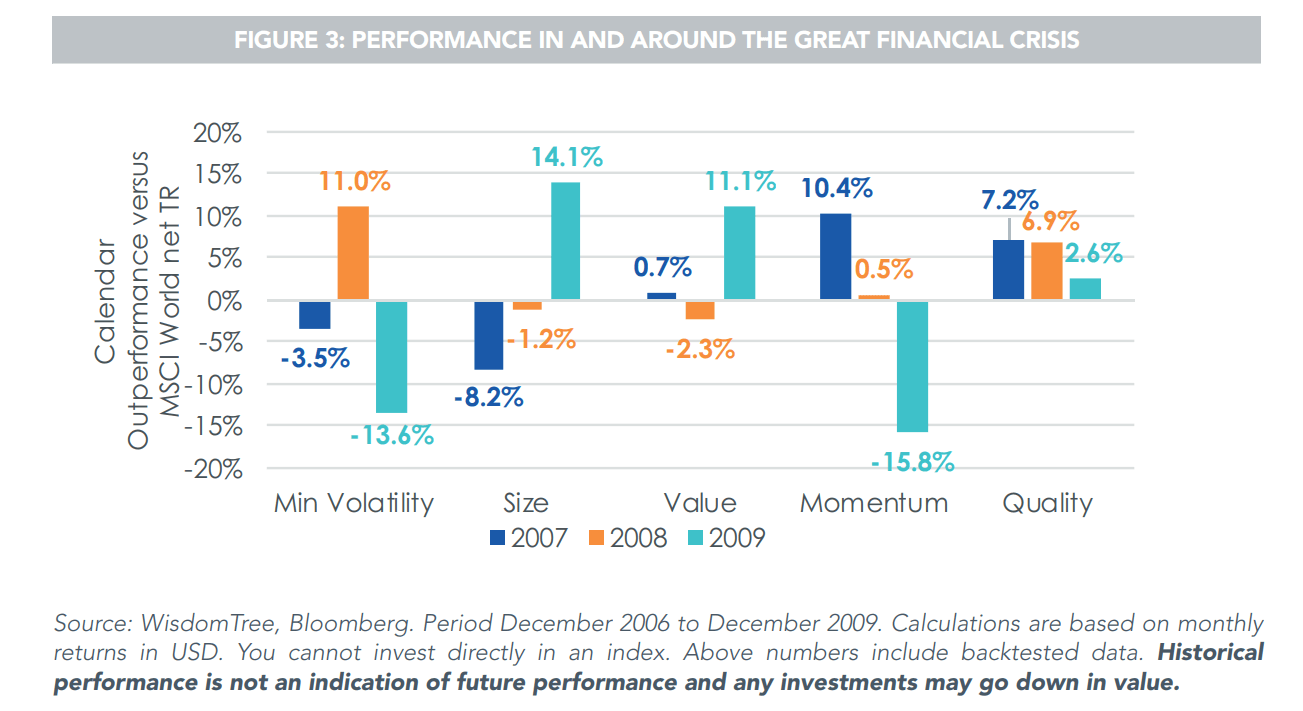
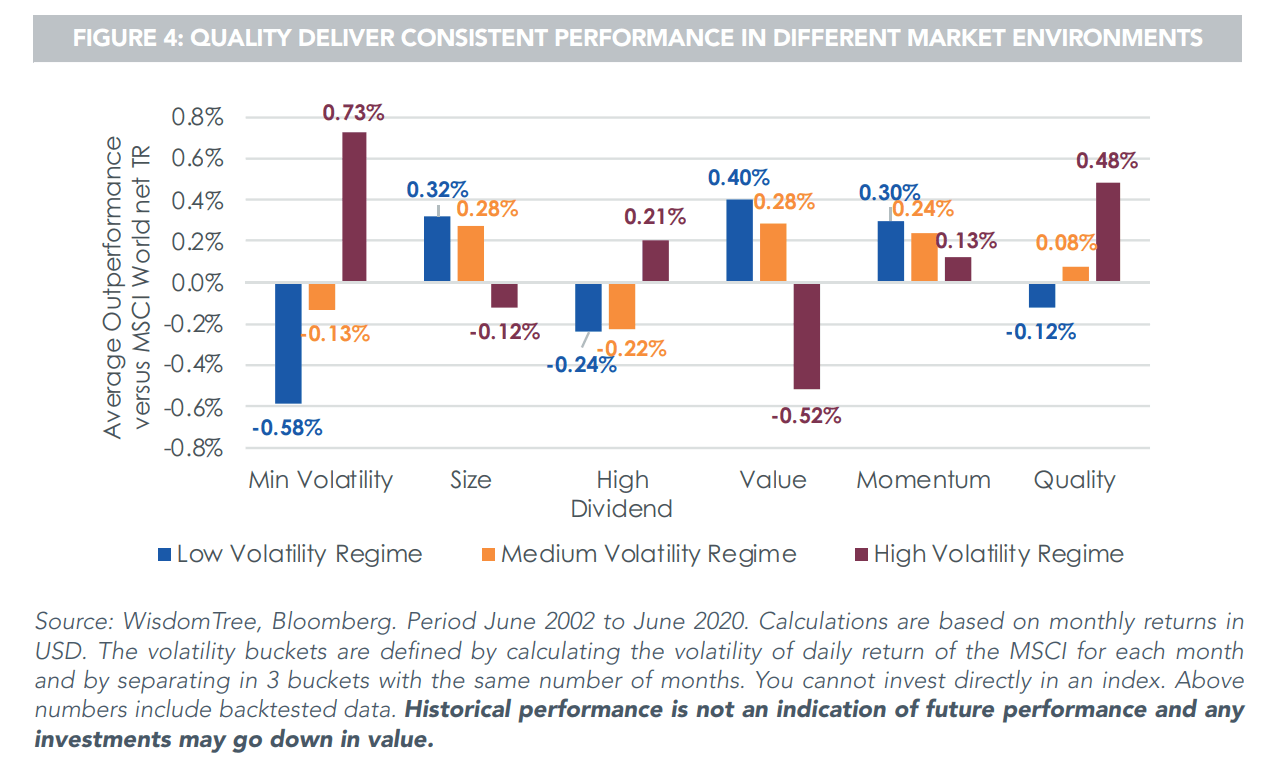
How the Quality Factor Does During Different Market Periods.
| Phase | Factor Performance |
| Before Correction | 1. Momentum 2. Quality |
| During Correction | 1. Quality |
| After Correction | 1. Size 2. Value |
If you want to trade these stocks I mentioned, you can open an account with Interactive Brokers. Interactive Brokers is the leading low-cost and efficient broker I use and trust to invest & trade my holdings in Singapore, the United States, London Stock Exchange and Hong Kong Stock Exchange. They allow you to trade stocks, ETFs, options, futures, forex, bonds and funds worldwide from a single integrated account.
You can read more about my thoughts about Interactive Brokers in this Interactive Brokers Deep Dive Series, starting with how to create & fund your Interactive Brokers account easily.
Kyith is the Owner and Sole Writer behind Investment Moats. Readers tune in to Investment Moats to learn and build stronger, firmer wealth foundations, how to have a Passive investment strategy, know more about investing in REITs and the nuts and bolts of Active Investing.
Readers also follow Kyith to learn how to plan well for Financial Security and Financial Independence.
Kyith worked as an IT operations engineer from 2004 to 2019. Currently, he works as a Senior Solutions Specialist in Fee-only Wealth Advisory firm Providend. All opinions on Investment Moats are his own and does not represent the views of Providend.
You can view Kyith’s current portfolio here, which uses his Free Google Stock Portfolio Tracker.
His investment broker of choice is Interactive Brokers, which allows him to invest in securities from different exchanges all over the world, at very low commission rates, without custodian fees, near spot currency rates.
You can read more about Kyith here.