


SWING TRADING (SHORT TERM)
Watchlist and Charts

3/31/2024 Markets were mixed for the week as the Semiconductors & Tech Stocks are having trouble going back up to the recent highs. The S&P 500 and NYSE Indices were able to go back up and make higher highs. Now the Semiconductors & Tech Stocks need to make higher highs to confirm the S&P 500 & NYSE Highs.
The 1st Quarter ended and the major Stock Indices were up 9-10 %, so that might be hard to achieve again this 2nd Quarter. The Stock Indices are still stretched Way Above the Green Lines on FOMO (Fear of Missing Out). When the S&P 500 Index finally has a “double top”, we will raise CASH, as we know from history that the Indices will meet again the Green Lines on the next FEAR Flush by the Media (to scare out investors who are Buying now).
We Buy the strongest Leaders on pull-backs. We like to Buy on Bad News like in late October, and take profits on Good News (like on Great Earnings now).

If you continue to Follow the Green Line System, your Account should flow into the Strongest areas and your Account value should be able to grow in both Bull and Bear Markets. Follow the MONEY, not the MEDIA.
______________________________________________________________________________
For the week the Dow was up 0.82%, the S&P 500 was up 0.39% and the NASDAQ 100 was down 0.53%. Many of the major Indices still have a Relative Strength below 80, so you should currently own the stronger Funds here.
The Inflation Index (CRB) was up 1.59% for the week and is Above the Green Line, indicating Economic Expansion.

Bonds were up 0.68% for the week, and are Below the Green Line, indicating Economic Expansion.
The US DOLLAR was up 0.30% for the week and is Above the Green Line.
Crude Oil was up 0.06% for the week at $80.63 and GOLD was up 3.63% at $2238.40, a new high.
_______________________________________________________________________
We are doing many micro Day Trades on our new Discord Trading Hub (free). Please join Discord on your cell phone app for the fastest Trade Alerts and Daily email notifications during the day. Other methods of notification have been too slow. Also, please check our our Live Trading Room on YouTube during Market hours.
More action this week on the Day Trading Scrolling Charts, and Day Trading Charts for Indices & Large Caps.
_______________________________________________________________________
SWING TRADE BUYS SOON:
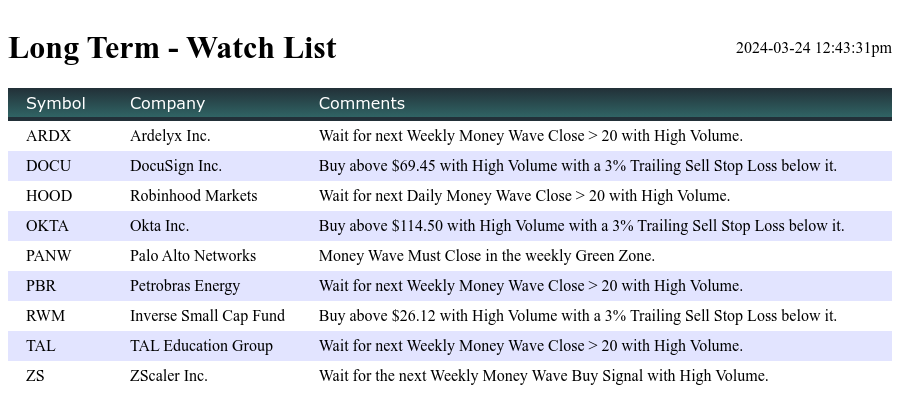
We are now in 4 Three Star logged Swing Trading Positions for the Short & Medium Term. There are 6 investments on the Short Term Watch List.
Be patient and WAIT for Green Zone Buy Signals!
______________________________________________________________________________
ATGL Long Term Weekly Watchlist- Click here for scrolling charts.
______________________________________________________________________________
Important Links
Alert! Market Risk is High (RED). The probability of successful Short Term Trades is better, when the % of stocks above the 50-day avg. is below 20.
Tell your Friends about the Green Line, and Help Animals.
______________________________________________________________________________
QUESTION: Peter W. writes “When you say the RSI should be “ABOVE 90 RS “. I look at your chart and it shows SCTR 90, not RSI. Please clarify.
ANSWER: Hi Peter. We don’t use RSI, which is a technical oscillator. We use Relative Strength compared to the Market:
Q: Where do I find the Relative Strength Factor in StockCharts.com so I can add it to my charts?
A: Relative Strength Values comes from the SCTR Rank (StockCharts Technical Rank), www.etfscreen.com for ETFs , and Investor’s Business Daily (IBD) for stocks. We prefer the longer term weighting used by www.etfscreen.com and IBD. We sometimes use a 155-day avg. of StockCharts SCTR, which is at the bottom left of many charts (just below the SCTR Rank) to simulate R S closer to the longer term ranking of IBD ranking.
Good trading, and tell your friends!
ATGL
Related Post
– Financial Instruments: Types & Classes.