


Some facts surrounding the history of the stock market are really astonishing. I would like to invite you into the world of Wall Street. Let us dive into my list of interesting stock market fun facts you should know about the global and US markets.
Around 54% of US households own stocks directly or indirectly through mutual funds, index funds, retirement accounts, etc. That’s a lot of money invested in the markets, so knowing more about the Stock Market only makes sense.

The NYSE Is The Largest Stock Exchange In The Entire World
Did you know that the New York Stock Exchange is the largest stock exchange in the entire world? With a market cap of $22.649 trillion (Jan 2023), it beats all of them. But, over the years, the growth of the NASDAQ was bigger.
Take a look at the comparison of the two stock exchanges of the U.S. Stock Market in comparison:

The title of the oldest exchange does not go to the NYSE. That is the Amsterdam Stock Exchange.

September Is The Worst Month To Invest
This phenomenon is also called the “September Effect.” Some analysts attribute this odd market behavior to seasonal effects in the markets. At the end of summer, some investors change their portfolios and cash out on some positions.
September is also the time most people have come back from their summer vacations and start doing more active trading again.
Whatever it may be, statistically, it is the worst month to invest with -0.7%, as you can see in the chart below:

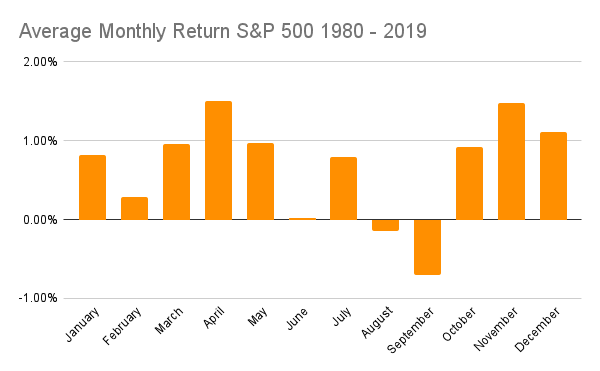
The best month to invest, according to this statistic, is April and November, with 1.51% and 1.48%, respectively.
The Bull And Bear Analogy In The U.S. Stock Market

Have you ever thought about what the hell a bull and a bear have to do with the stock market?
On Wall Street, you speak of a Bull Market if everyone is in a buying mood. A Bear Market is the exact opposite. Nobody wants to buy. But what is the analogy to these scary mammals?
Apparently, the bear came before the bull. It originates in a proverb that cautions against “sell[ing] the bear’s skin before one has caught the bear.”
By the 18th century, the phrase “bear-skin jobber” was widely used as a synonym for a seller.
The bear was chosen around 1720 as a symbolic opposite to the bear. One of the first mentions of it can be found in the writings of poet Alexander Pope:
“Come fill the South Sea goblet full;
The gods shall of our stock take care:
Europa pleased accepts the Bull,
And Jove with joy puts off the Bear.”
Another explanation that you might already have heard is the nature of how these animals attack. A bull attacks with an upward motion, while a bear attacks by slashing downward. It is certainly a more visual explanation.
There Is No 20 Year Period That Would Have Lost You Money In The S&P 500
Yes, it’s true! Take a look at the historic performance of the S&P 500 in the last 100 years.

Your odds of keeping your money and gaining more increase the longer you invest. When you invest for 20 years, it is pretty certain that you will at least keep the money you invested. In most instances, you will have positive annual returns!
Many Mutual Funds or ETFs allow you to invest in the S&P 500 index fund.
We all know that you would have made a fortune if you would have invested in Amazon early on. But did you know that a 90% decline would have also been in your cards on that massive gain until today? It happened in the stock market crash we now know as the Dot-Com Crash.
This shows the extreme mental challenge that you might have to go through as a long-term investor. Would you have held on to your investment if it lost 90%, or would you have lost your hope and sold?
This 90% decline would also not be the only significant one over the entire holding period. Take a look at the table below showing three more declines you would have to endure.
Just think about the emotional ride you would have to endure during these negative events.
| Time Period | High | Low | Decline |
|---|---|---|---|
| April 1999-Aug. 1999 | $105.06 | $44.78 | -57% |
| Dec. 1999-Sept. 2001 | $106.69 | $5.97 | -94% |
| Oct. 2003-Aug. 2006 | $59.69 | $26.07 | -56% |
| Dec. 2007-Nov. 2008 | $94.45 | $37.87 | -60% |
Amazon Stock Price Declines, source: Google Finance
It’s always easy to see the opportunity in hindsight, but at the time, it was much harder to see. The only way for you to gain that edge in the market is by understanding company financials. If you learn how to read financial documents (Income Statement, Balance Sheet, Cash Flow Statement), you can put yourself in a much better position. You enable yourself to see if a company has a good foundation or not.
Ronald Wayne Co-Founded Apple And Sold His 10% Shares For $800
Besides the well-known Steve Jobs and Steve Wozniak, Apple has a third Co-Founder: Ronald Wayne. Only 12 days after founding the Apple Computer Company, he sold all his shares to Steve Jobs and Steve Wozniak, amounting to 10% ownership. One year later, he accepted a final $1,500 to forfeit any future claims against the company.
It’s easy to see that this was his biggest mistake in life. He has stated multiple times that he doesn’t regret his decision, though. He just made “the best decision based on the information available at the time” (source).
COVID Recession was the shortest on record, only lasting 2 months
A recession, on average, lasts 11 months. When COVID hit, we all witnessed the shortest recession on record, with just 2 months to amount to a full recovery. It was one of the most volatile markets in history.
Take a look at the recessions from 1929 to 2022:
US Recessions from 1929 to 2022
The stark difference becomes very clear if you look at the chart showing their lengths:

Statistically, The Market Goes Up 2 Years Out Of 3
This stock market fun fact is a great one to keep in mind if you are a long term investor. David Gardner, Co-Founder of The Motley Fool talked about that in his Rulebreaker Investing podcast.
If you look at the data, the market goes up 2 years and down 1 year out of every 3 years. Of course, these are just averages. Individual 3-year periods can look dramatically different. When a bear market happens, it usually lasts for 12 to 18 months until the market goes up again.
Apple Was The First Company To Breach $1 Trillion
What do I mean by $1 Trillion? I’m speaking of the market capitalization. This is complex for the size of the company.
Every company has a finite number of shares in the market – even if it doesn’t feel that way when you buy stocks in your brokerage account. They are called shares outstanding, and you can look up that number in portals such as Yahoo Finance. If you multiply that number by the price of one share, you get the market capitalization or size of that company at that time.
Apple was the first company in the history of the stock market to ever reach $1 trillion. By the end of July 2017, Apple breached that sentimental value of $1 trillion.
What’s interesting is that if you look globally, Apple was actually not the first company to breach $1 trillion. It only holds that title in the US stock market. Dutch East India Company was a company transporting spices and luxury goods via ships to Europe in the 16th century. The company’s overall market cap reached 78 million Dutch guilders in the early 1600s. That amounts to ~$8.2 trillion today.
Microsoft’s Market Cap Is Higher Than The GDP Of Italy, Brazil, And Canada
At the time of writing, Microsoft’s market cap sits at $3.009 trillion! That is a huge number just by itself. It has a clear spot in the list of the largest companies in the world.
If you compare this to the GDP of well-known countries in the world, you can get a better sense of just how big Microsoft is:
Italy, Brazil, and Canada all lose in size compared to Microsoft. And I believe more countries are going to lose that same comparison in the future.
Right now, Microsoft and Apple are fighting for the title of the biggest company in the US stock market. It will be interesting to see how the picture develops a few years from now.
Berkshire Class A Stock Is The Most Expensive Share
The Class A stock of Berkshire Hathaway comes in at $574,515.81 a piece at the time of writing. That is an astonishing number to acquire just one stock!
Warren Buffett never performed a stock split for his Class A stock. He thinks that the disadvantages of a stock split outweigh the advantages. The high price of the stock attracts more investors with a long-term view of their investment.
Instead, he introduced a less expensive Class B stock in 1996. The goal was to allow more individual investors to invest in Berkshire Hathaway directly. At the time, fractional shares were not traded.
The Class B shares did go through a huge split of 50 to 1 in 2010. That lowered the price of one share to ~$70 at the time. Now, that same stock is trading at $380.32.
The NYSE Was Originally Named Differently
Every stock investor knows the NYSE (New York Stock Exchange) and the NASDAQ (National Association of Securities Dealers Automated Quotations). Bud, did you know that the NYSE was not always named like that?
“The exchange evolved from a meeting of 24 stockbrokers under a buttonwood tree in 1792 on what is now Wall Street in New York City.” writes one of the Encyclopaedia Britannica’s editors (source). The document that emerged from that meeting is called the Buttonwood Agreement. They formally adopted the name New York Stock and Exchange Board in 1817. The name was changed in 1863 to New York Stock Exchange – the name we know today.
US Stock Market is 54% Of The Entire Global Stock Market
Probably everybody knows that the stock market in the United States is big. But did you know that it represents almost half of all global financial markets? Sometimes, it is hard to wrap your head around how big it really is!
Take a look at how the different markets compare in Q4 of 2023:
The dominance of the US Stock Market is undeniable.
The S&P 500 Goes Up 55% And Down 45% Of The Time
This Stock Market fun fact might come as a surprise to you if you are not an investor. On a day-to-day basis, one might think that the odds are 50:50 for the market to go up or down – basically a coin flip. But that is not the case.
Andrew Sather has analyzed the historical data of the S&P 500 from 1996 to 2021. He found that from 1996 to 2016, there were 53.29% of up-days and 46.71% of down-days. From 2016 to 2021, there were 54.86% of up-days and 45.14% of down-days.
So, the odds are indeed a tiny bit better than a coin flip. And this is part of the reason why long-term investors have an edge in the market. This is true, despite the existence of stock market corrections and crashes.
Most Trades Are Made By Robots
Robots are invading all areas of our lives. And the stock market is no exception to that.
In 2017, JPMorgan estimated that 60% of trades are done by robots or automated stock investment programs. Estimates for 2023 come in at 60-73%.
I expect the number of stock trading done by algorithms to climb even more in the coming years, especially with AI-powered tools gaining much more momentum. Tools that invest based on technical analysis of the stock prices are available in all shapes and forms now. They often focus on a short term trading strategy.
Final Thoughts – 15 Interesting Stock Market Fun Facts You Should Know
And this is my list of interesting stock market fun facts. I love diving into the world of stock market statistics and interesting facts. It is a fun exercise for me! It can teach you a lot about how these global markets are really working.
Whether you are a first time investor, or a seasoned veteran in the field, I hope you have learned something new today.