


By Dr. Francis Bayes, WCI Columnist
One of the first steps of developing a financial plan is calculating how much one needs to save every year over a time period in order to reach a target number for one stage of financial independence.


In Microsoft Excel or Google Sheets, this is done with the PMT formula in which we enter: expected annual real return, number of years, and target number. Although our portfolio’s performance is out of our control and unpredictable, we need to be aware of its performance (i.e., annualized real return) so that we can adjust our financial plan by increasing our saving rate, working for a few more years, or changing our asset allocation.
This column is a step-by-step guide on how to keep track of our portfolio’s annualized real return.

How to Calculate Your Money-Weighted Return
Money-weighted return (MWR), aka dollar-weighted return or internal rate of return (IRR), is focused on how your decisions perform over time. For individual investors, it is more appropriate than time-weighted return (TWR) or compound annual growth rate (CAGR) because we are in control of the cash flows. MWR tells us whether we are implementing our financial plan or letting cash idle.
Calculating your MWR is the hardest and most cumbersome step. WCI’s OG, Dr. Jim Dahle, has written about MWR and how to calculate it on Microsoft Excel and Google Sheets; this post from Kitces.com has the nitty-gritty on the differences between TWR and MWR. But if you trust the math and want to just plug in the numbers, here are key reminders based on my experience:

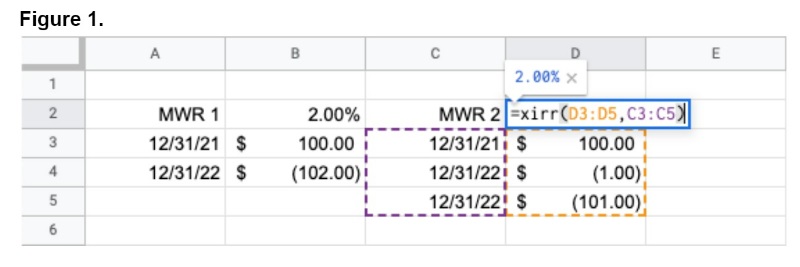
#1 You Should Always Ignore Dividends Unless You Withdraw Them
Whether you reinvest dividends automatically, you should not enter dividends because they are a part of your invested money’s performance. Another way to think about it is that you should only include money that passed through your checking account. If $100 of your stock ABC becomes $102 at the end of the year, it does not matter whether the $2 is due to its 2% increase in price or to a 2% dividend. If you withdraw any dividends, you should enter the date of withdrawal and the amount. You can see in Figure 1 below that your return (MWR 2) is still 2% after you withdraw $1 of the dividend from your invested money.
#2 You Should Focus on the Cash Flows, Not the Transactions

MWR should be used to track the annual return of different accounts (e.g., taxable, “fun money account”) or portfolios (e.g., financial independence, college savings). One may want to track the MWR for each asset class (e.g., stocks, bonds) or specific real estate investments. Just because you can (and Jim does so), it does not mean you have to calculate the MWR for each asset class.
The MWR would not be appropriate for comparing the performance of different asset classes because the dates on which you buy and sell different assets might be arbitrary. It might tell you whether your timing was lucky for rebalancing your portfolio. Assets that you buy bimonthly with your paycheck might perform better than assets you buy lump-sum in January in some years like 2022. If you want to reevaluate your asset allocation after 10-20 years, the annualized MWR is indicative of your investing behavior, not your investing plan. Instead, you should use CAGR to assess the performance of your assets over the same time period.
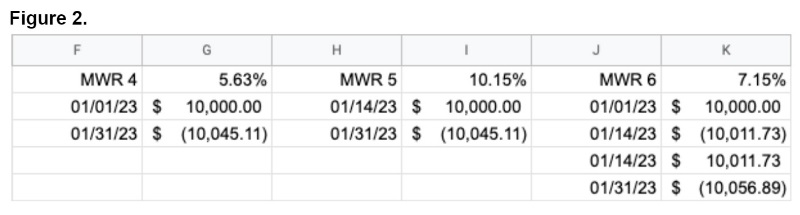
For each account or portfolio, entries for MWR should be deposits and withdrawals (i.e., cash flows) rather than buying and selling of assets (i.e., transactions). For example, let us imagine a scenario in which you automatically deposited $10,000 into your taxable account on January 1 but waited until January 14 to buy an asset with an annual return of 10% (Figure 2). Your account’s annualized return on January 31 would be 5.63% (MWR 4). Had you kept the $10,000 in a high-yield savings account (with an APY of 3.30%) until you bought the asset on January 14, your return would be 7.15% (MWR 6). But if you enter transactions rather than cash flows (MWR 5), you are assuming that you did not have $10,000 between January 1 and January 14. MWR 5 is higher than MWR 6 even though your laziness or market timing cost you $12 in real life.
#3 If You Calculate the Money-Weighted Return Before the End of the Year, It Might Seem Wrong, But It Is Not
Let us imagine another scenario in which you deposit $10,000 into your taxable account on January 14, 2023, and purchase the asset right away without knowing its expected annual return (just as in real life). When you check your account balance and calculate the MWR on January 31, you might wonder how the asset’s MWR could be 10.15% when you only have $10,045. This is because the MWR is annualized. If the asset’s annual return happens to be 10%, then you would have $11,000 in your account on January 14, 2024, and your MWR for the period would be 10%.
More information here:
When You Should Consider Buying Even More Stocks
How to Calculate Your After-Inflation (‘Real’) Return

If you need $1 million to sustain your current lifestyle in retirement, then you need to have $1 million in 2023 dollars in the future. For instance, $1 million in 1996 (when The Millionaire Next Door was published) would have the same purchasing power as about $1.9 million in 2023 because of inflation. This is why we enter the expected annual real (not nominal) return into the PMT formula to calculate the amount we need to save every year. If you enter the expected annual nominal return, then you are predicting not only your portfolio’s return but also inflation.
Love it or hate it, the 12-month percentage change in Consumer Price Index (CPI) is a common proxy for the annual inflation rate. Every mid-January, you can go to the US Bureau of Labor Statistics website when it publishes the CPI for the preceding December and the 12-month percentage change. Or you can go on websites like this for a table of historical inflation rates. We use the annual inflation rate—not the average inflation rate (which is the average of monthly inflation rates)—because we are interested in how much $1 is worth at the end of 2022 compared to the end of the prior year.
If your portfolio’s MWR in 2022 was -10%, should you subtract 6.5% (the percentage change between December 2021 and December 2022) from your nominal rate (-10%) to calculate your after-inflation return (-16.5%)? Nope!
The formula for your real return is: = (1 + nominal rate) / (1 + inflation rate) – 1.
Thus, your real return for 2022 would be -15.5% because: (1 – 0.1) / (1 + 0.065) – 1 = -0.155.
How to Calculate Your Annualized Real Return
You need to first understand the difference between arithmetic mean and geometric mean. Dr. Daniel Smith, fellow WCI columnist, explains it better than I could in his column. The formula for geometric mean, according to Investopedia, is “taking the product of [a series of] numbers and raising it to the inverse of the length of the series.”
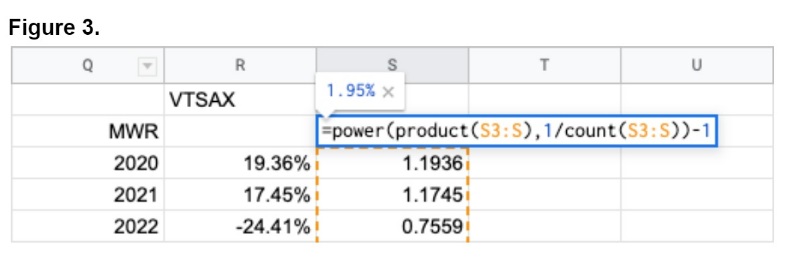
If you want to create your own spreadsheet, then you can use the following formula in which values “a, b, c, . . .” are your annual returns: = power(product(a, b, c, . . .), 1/count(a, b, c, . . .)).
I have not figured out a way for the formula to work if I have a series of percentage values, because unfortunately, some years will have negative returns (e.g., 19%, 17%, -24% . . . ). Instead, I need to have a series of (1 + annual real return) for each year so that every value is greater than zero (Figure 3). Using the formula, the annualized real return of VTSAX over the past three years is 1.95%.
More information here:
How to Stay Focused When Everyone Else Is Getting Rich
Should You ‘Stay the Course?’
If your annualized real return is less than the expected annual real return that you used in your financial plan, your response might depend on how much human capital you have left. At my paygrade, I can only speak from my experience as a 30-something trainee. If you are a trainee or early in your journey to financial independence, it should not be a big deal as long as you are meeting your target savings rate.
I only calculate the annual real return each year so that I would not have to calculate 20 years of returns later. My wife and I are thankful that our annualized real return has not been less than expected, but even if it was, we would have stayed the course. Not only are our best saving years ahead of us, but also our financial independence portfolio is almost entirely stocks. We will reconsider our plan only when we evaluate our annualized real return for our first 20-year period of saving. Until then, we will follow Saint Jack Bogle’s most important investment advice and stick to the program.
How do you track your returns? Do you like getting in the weeds with spreadsheets, or is the juice not worth the squeeze? What other suggestions do you have? Comment below!

